Waste doesn't disappear. Make its impact visible.
GreenLoop AI connects waste reporting, intelligent classification, verified collection, and environmental analytics in one accountable workflow.

18.5kg plastic beverage containers reported at North Courtyard.
Diversion
74.2%
Avg Response
4.8h
Verified Net
2,840 kg
AI-Assisted Classification
Computer vision identifies polymer & fiber streams.
Location-Aware Reporting
High-precision spatial geotags across campus zones.
Verified Collection
Photographic before & after evidence audit trail.
Measurable Outcomes
Transparent recycling rates & landfill diversion.
The problem isn't just waste. It's what happens after it.
When a resident or student spots an overflowing bin or hazardous electronic scrap, reporting is fragmented across informal emails, broken ticket portals, or overlooked chat threads.
Without automated material identification and verifiable spatial evidence, collection teams arrive with mismatched equipment, recyclable polymers are cross-contaminated into landfill bins, and institutional sustainability reports end up relying on unverified estimates.
Traditional facilities software stops at the ticket. GreenLoop verifies the physical resolution and audits the downstream material stream.
Invisible Incidents
Reports lack spatial coordinates, accurate imagery, and urgency tiers. Incidents sit in generic facilities inboxes for days without triage.
Uncoordinated Collection
Custodial teams arrive without knowledge of volume or material danger, causing hazardous electronics or heavy metals to be routed to landfill compactors.
Single general cart dispatched. 32kg lithium e-waste improperly compacted.
Vision AI detects ESD threat. Hazardous crate & specialist dispatched automatically.
Unverified Environmental Claims
Organizations claim high recycling percentages without immutable audit logs. Without photographic before-and-after proof, reporting is vulnerable to greenwashing scrutiny.
One loop. Five connected actions.
A cohesive architecture connecting community reporting to audited institutional recycling outcomes.
AI Waste Classification
Leveraging server-side Gemini multi-modal vision models to inspect visual textures, distinguish recyclable polymers from municipal landfill streams, and flag hazardous items.
Test an example image in real time:
Detected HDPE and clear PET polymer containers. High purity recovery rating.
Direct to Campus Baler Stream #4. Segregate non-polymer caps.
Live Incident Mapping
Interactive spatial map of campus sectors with real-time status indicators. Color-coded markers distinguish reported, in-progress, and verified collection sites.
Collection Coordination
Route tasks to dedicated personnel with priority weighting, equipment checklists, and time-to-collection SLAs.
Task TSK-101: Life Sciences Dock
Assigned: Marcus Vance • Due 14:00
Task TSK-102: Student Union Patio
Assigned: Marcus Vance • Organics
Verification & Accountability
Every resolution mandates post-collection photographic evidence. Administrators review the audit trail before closing the incident loop.
• Overflow Confirmed • Audited & Closed
Environmental Impact Analytics
Transparent metrics computed directly from verified incident closures: gross tonnage, segregation fidelity, recycling rate, and landfill diversion.
Diversion Rate
74.2%
Campus benchmark
Waste Diverted
2,108 kg
From regional landfill
Audit Index
100%
Verified with photo
Know where action is needed.
Real-time operational map aggregating public waste incident reports across campus quadrangles, lab docks, and dining facilities.
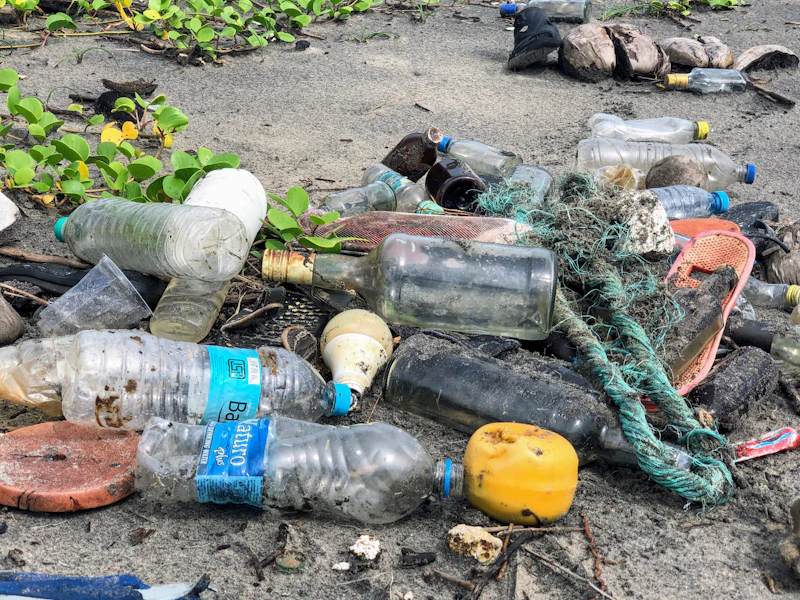
Discarded Polyethylene & Single-Use Bottles
Student Activity Centre (SAC) Courtyard
Significant buildup of beverage bottles and single-use plastic containers near the Student Activity Centre (SAC) Open Air Theatre following the weekend tech symposium.
Route to Blue Baling Station #4. Decontaminate caps and labels in optical sorter.
From one report to a verified outcome.
Explore each stage of the closed loop. Click any phase to inspect the data transition and accountability safeguards.
REPORT
A student, resident, or staff member snaps a photo. GPS coordinates, timestamp, and optional notes are captured automatically with no mandatory app download.
Camera upload & 28.7485° N, 77.1168° E geotag
All status transitions require signed actor ID and timestamped event record.
Make environmental progress measurable.
Real numbers derived from verified incidents. Every kilogram logged on GreenLoop maps to a physical geotag and photographic proof.
Total Waste Collected
Gross weight of all segregated materials recovered across campus collection operations.
Campus Recycling Rate
Ratio of diverted recyclables (Plastics, Paper, Organics, Metals) vs total collected stream.
Avg. Resolution Time
Time elapsed from public report submission to physical staff collection & before-photo verification.
Landfill Diversion
Net weight diverted from regional landfill through MRF recovery and campus anaerobic composting.
Unlike traditional sustainability dashboards that estimate diversion from static annual waste hauling bills, GreenLoop aggregates bottom-up verification for each distinct incident.
Estimated CO₂e Abated
~3,820 kg
EPA WARM diversion factor
Verified Audit Rate
100.0%
Photographic geotag
Built for campus operations.
Inspect the real desktop interface used by sustainability officers, facility managers, and collection dispatchers.
Campus Health
All 6 collection sectors reporting nominal SLAs.
6
4
1
83.5%
Environmental data should be accountable.
Clean sustainability metrics must withstand institutional scrutiny. GreenLoop embeds verifiable evidence into every record.
Traceable Lifecycles
No incident vanishes without an immutable audit record of its initial state, assignment, and closure.
Empirical Verification
Resolution requires physical before-and-after photographic evidence and weigh-in telemetry.
AI Advises, Humans Decide
Vision models propose characterizations and safety notices, but trained staff make the final disposition.
Role-Based Governance
Strict server-side permissions distinguish community reporters, custodial field staff, and facility directors.
Sample Incident Audit Trail (INC-2026-081)
Each entry records exact UTC timestamp, actor identity, verified cryptographic hash, and physical telemetry:
Close the loop. Leave less behind.
Start with one reported incident. Build a clearer picture of institutional environmental progress across your campus or community.
Open Demo Mode • Fully Interactive • Zero Registration Barrier for Evaluation